Metric Relationship Graph
ROLE
Product Design Intern
TIMELINE
May - Aug 2025
SKILLS
Systems thinking, prototyping,
design systems
TEAM
2 Engineers, 1 PM
Helping engineers easily trace the root cause of failing metrics.
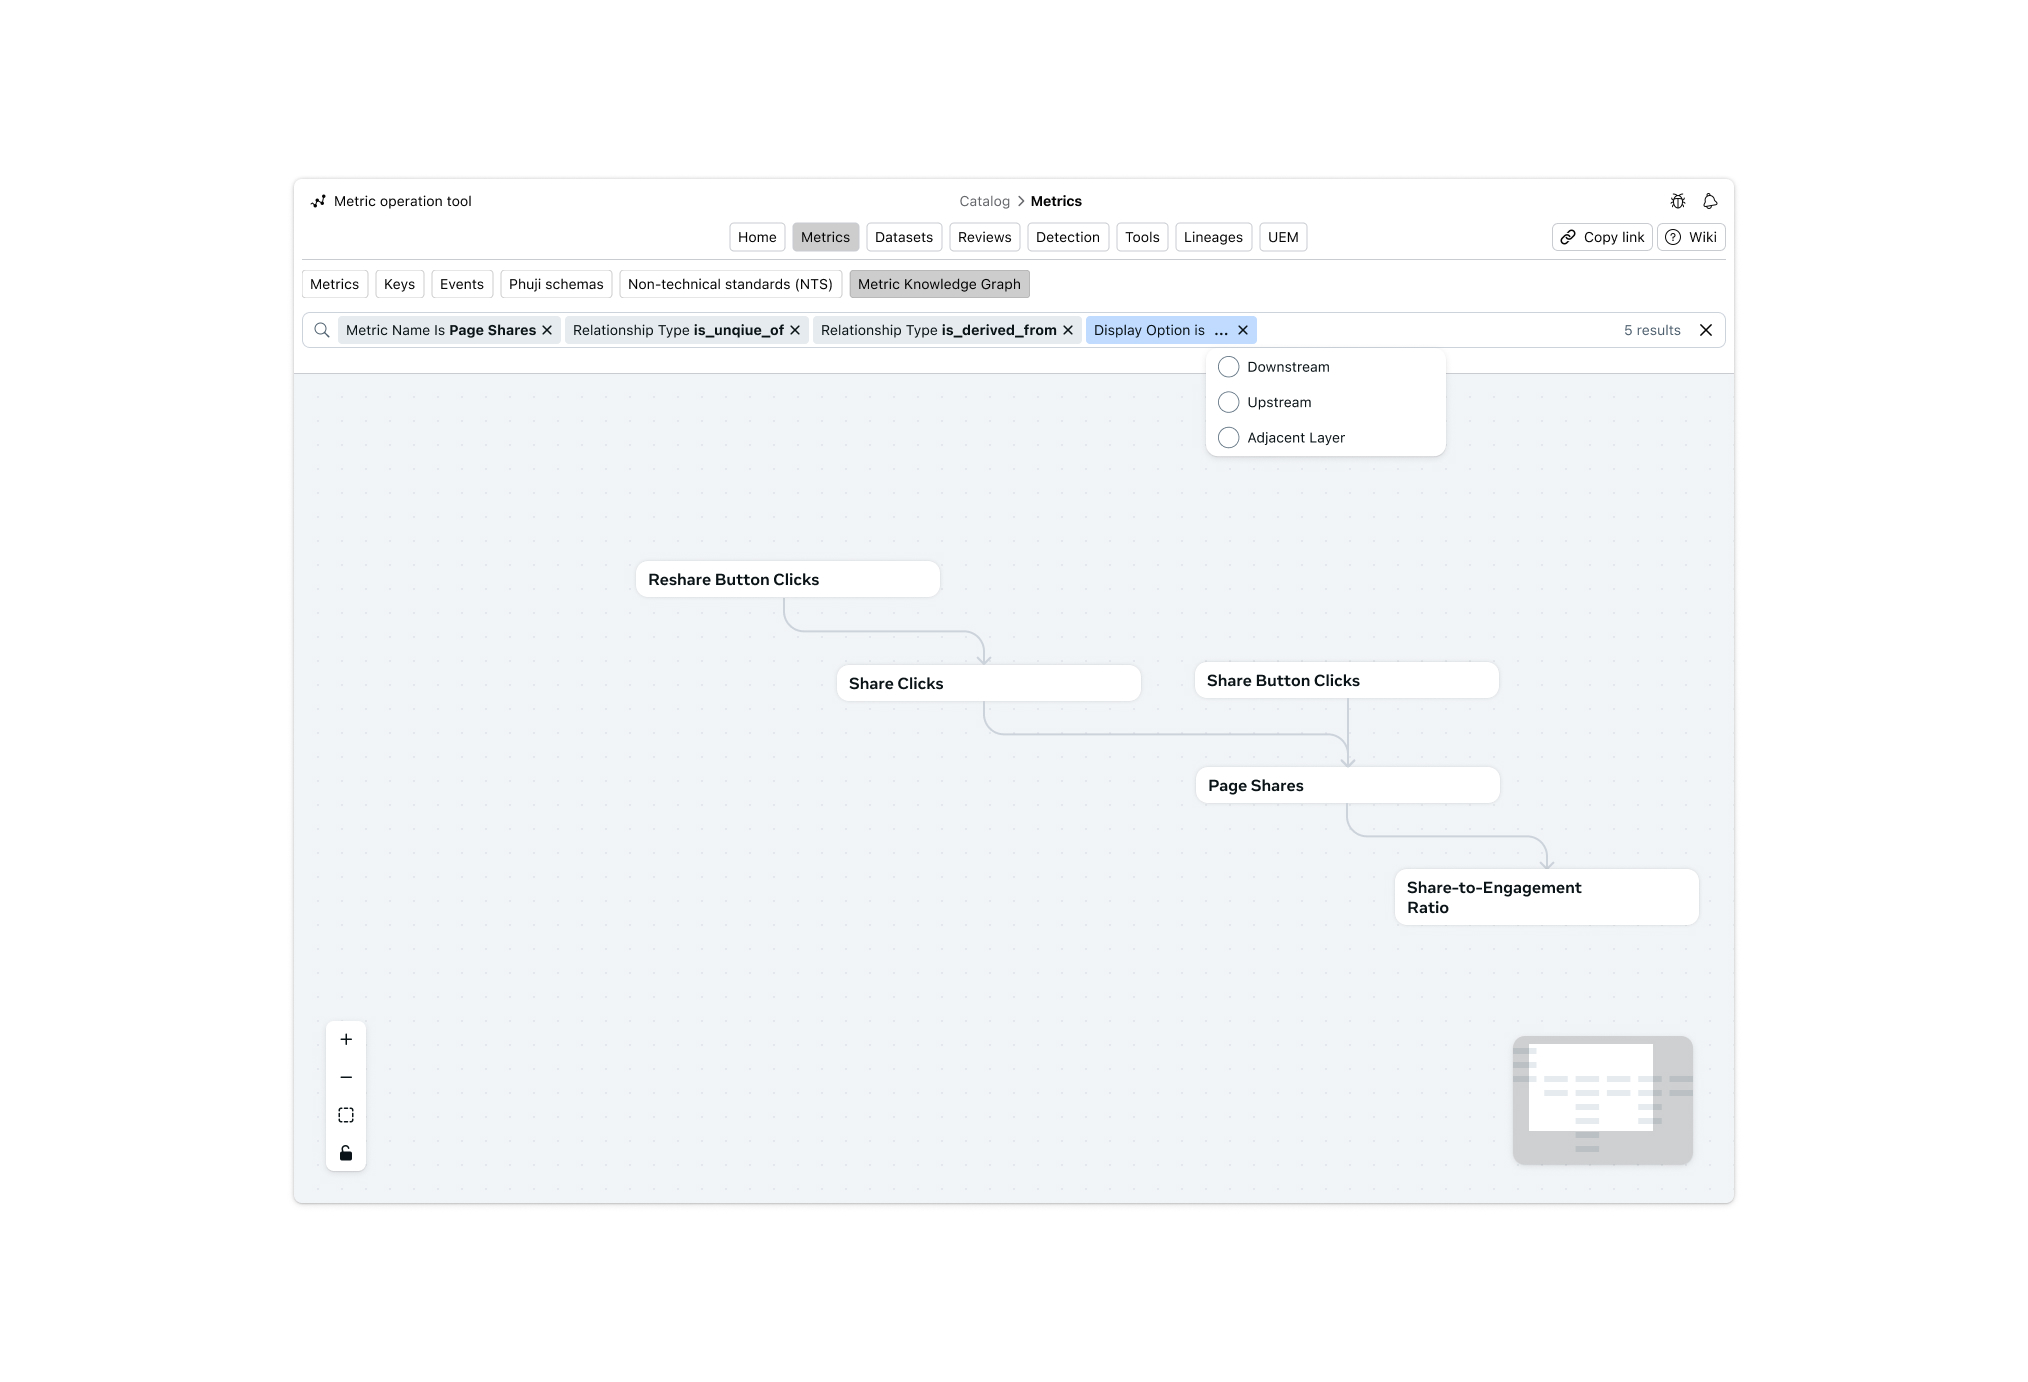
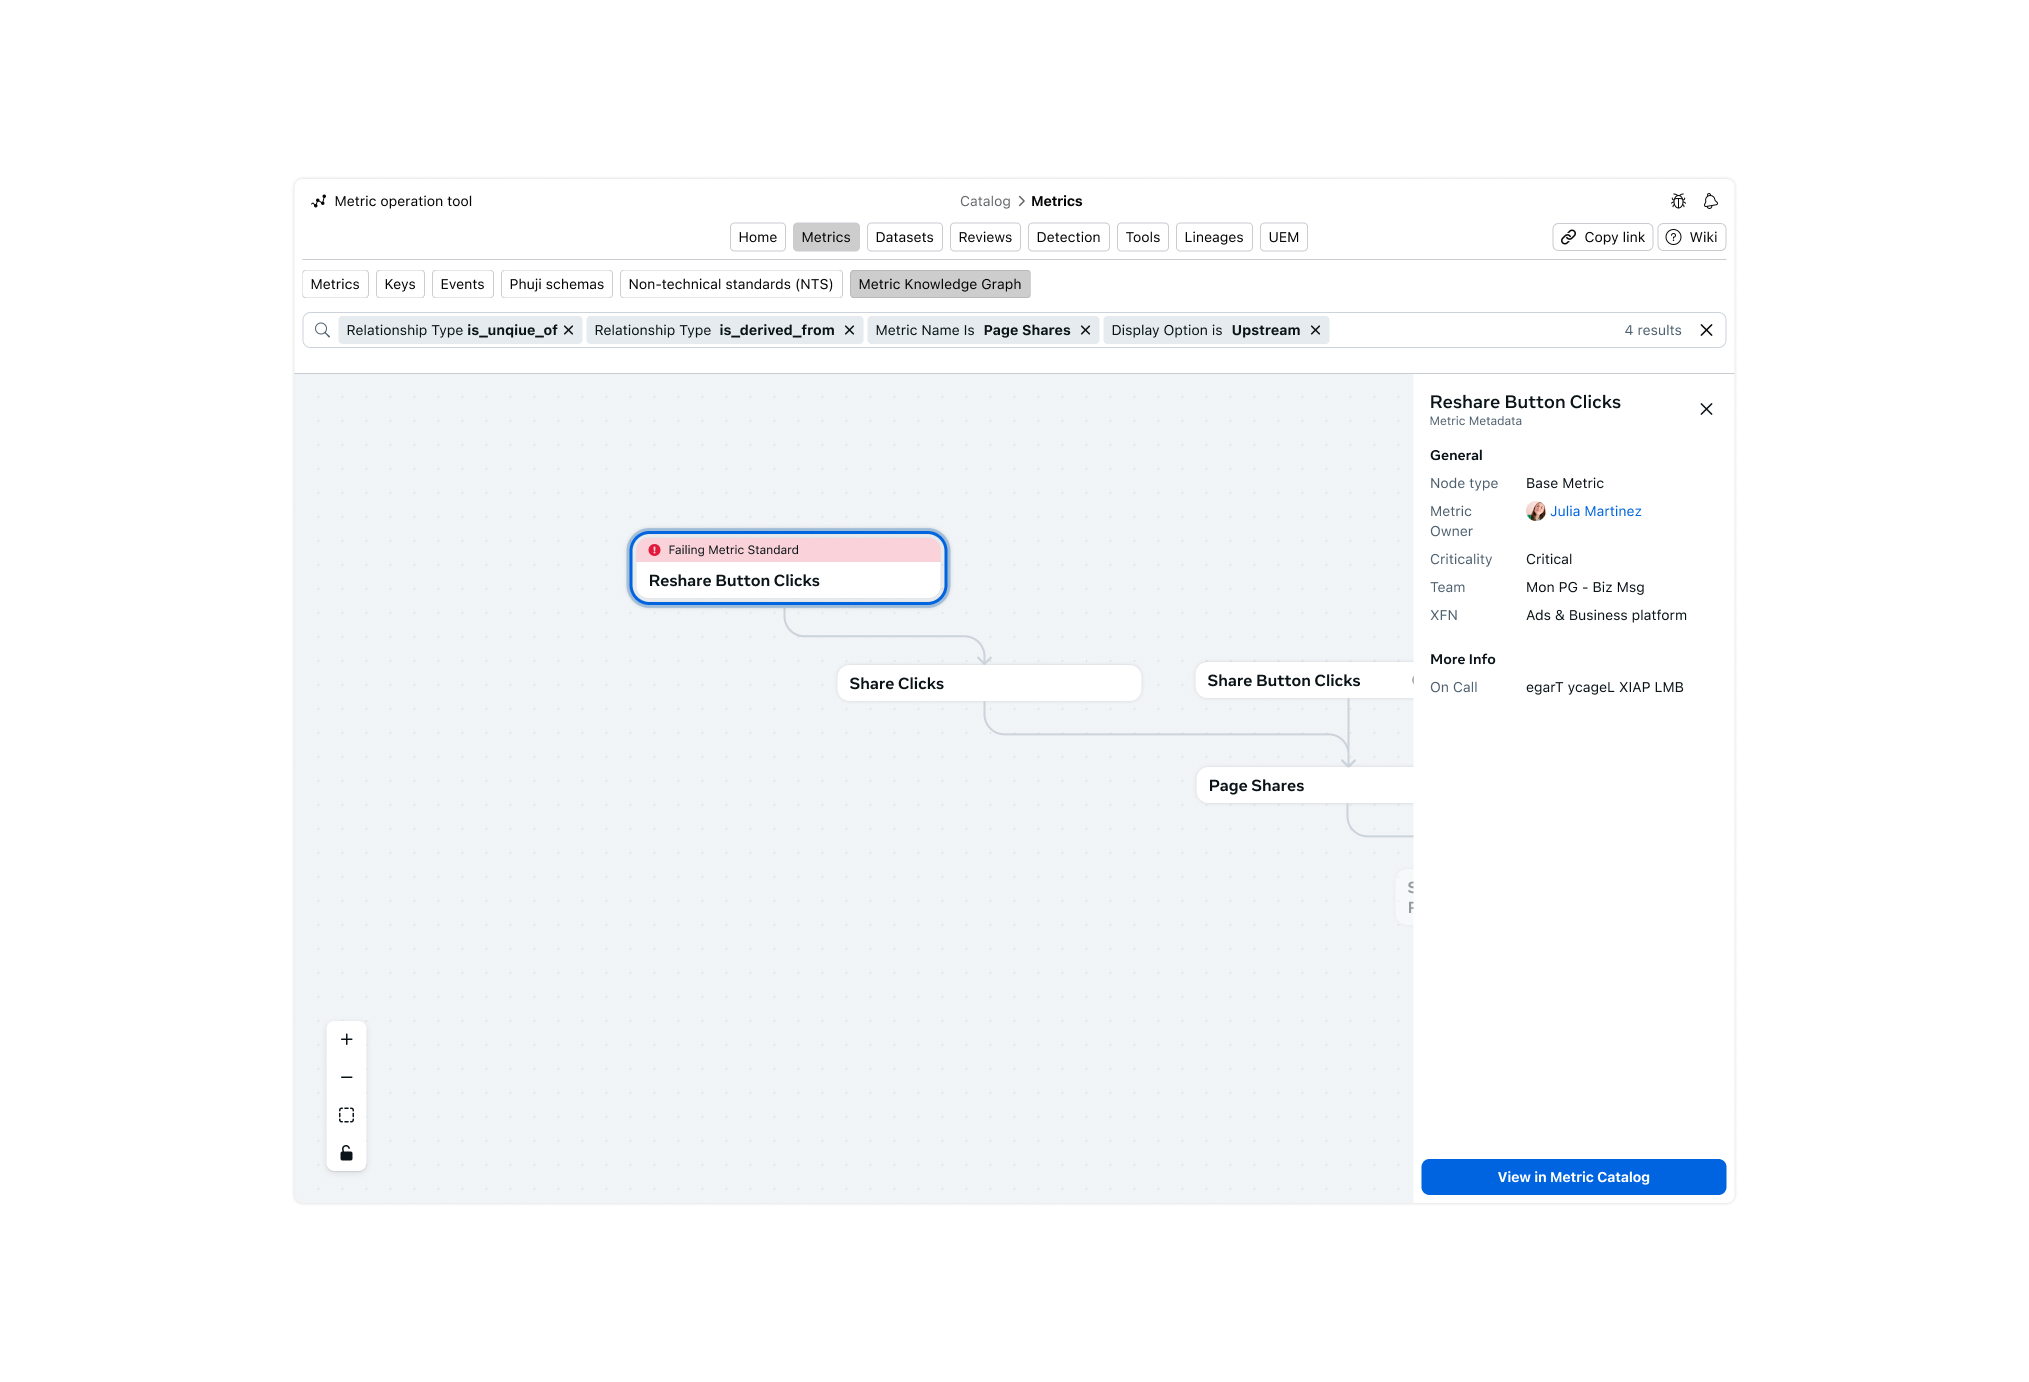
In addition to my main project at Meta, I worked on designing an interactive visualization tool to help engineers understand how different metrics are related and debug metric inaccuracies.
Currently, there isn't an effective way for engineers to quickly understand relationships between metrics, which makes it hard for them to trace why certain metrics aren't passing. Our goal was to help engineers debug faster by providing a clear visual representation of metric relationships and dependencies.
To tackle this challenge, I explored the following questions: How does the nature of different data translate to different visualization needs? How can we help people easily narrow down to the metrics that they care about? How can we help people navigate the visualization with increasing complexity? Please reach out directly if you'd like to learn more about the work.